


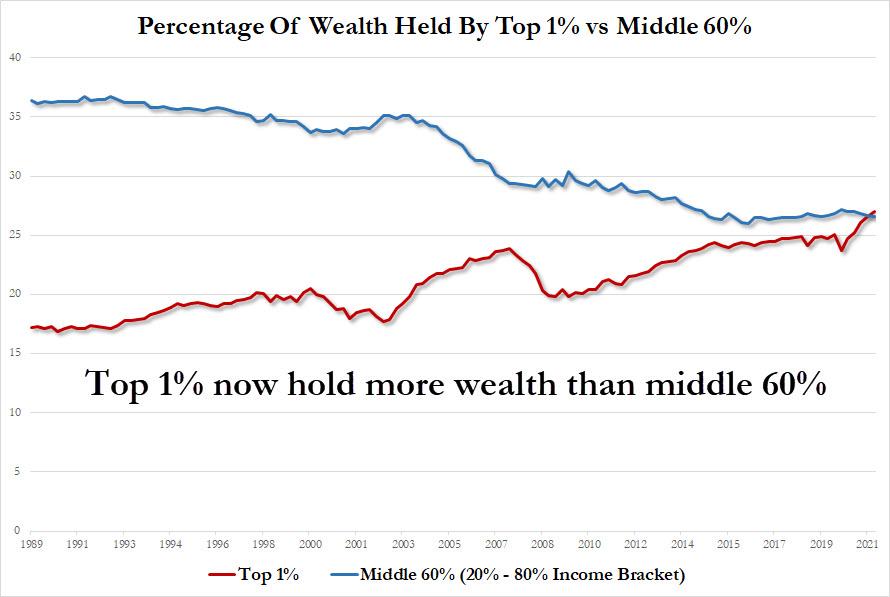
Over the weekend, we showed a staggering wealth distribution statistic cementing the US status as a banana republic: according to Fed data which breaks down the distribution of wealth according to income quintile (or 20% bucket) the middle 60% of US households by income saw their combined assets drop from 26.7% to 26.6% of national wealth as of June, the lowest in Federal Reserve data, while for the first time the super rich had a bigger share, at 27%.
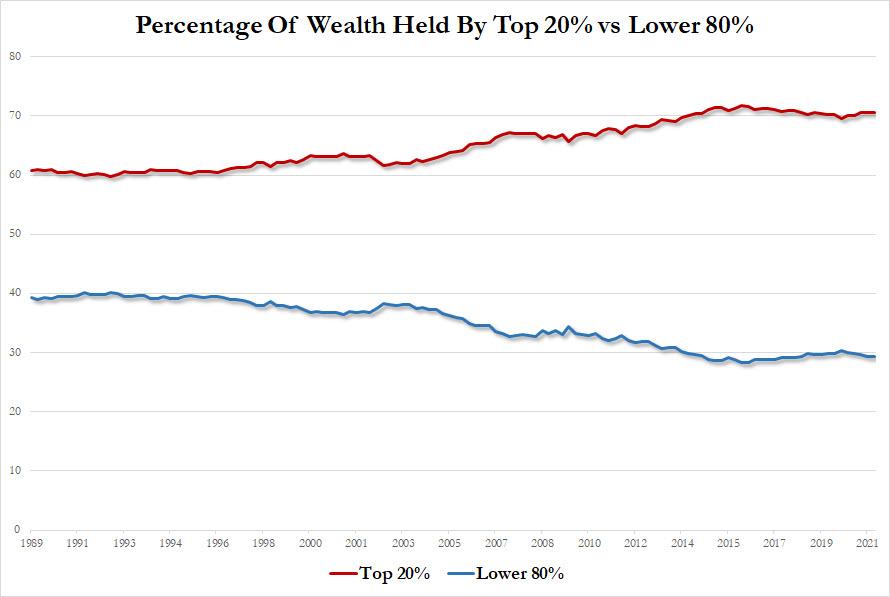
While especially true for the top 1%, it is all the rich that have benefited from the Fed's generous liquidity pump at the expense of the extinction of the US middle class - as the next chart shows, over the past 30 years, 10 percentage points of American wealth has shifted to the top 20% of earners, who now hold 70% of the total. The bottom 80% are left with less than 30%.
But while we have extensively discussed the destructive impact of the Fed on the middle class - while enriching the top 1% - a view espoused recently by Stan Druckenmiller who in May called the Fed the single "greatest engine of wealth inequality" in history (to which we would also add the end of the gold standard under Nixon), some have asked what about the sub-middle class? After all one can argue (correctly) that the swing voter in the US is not in the top 1%, but rather in the bottom 50%.
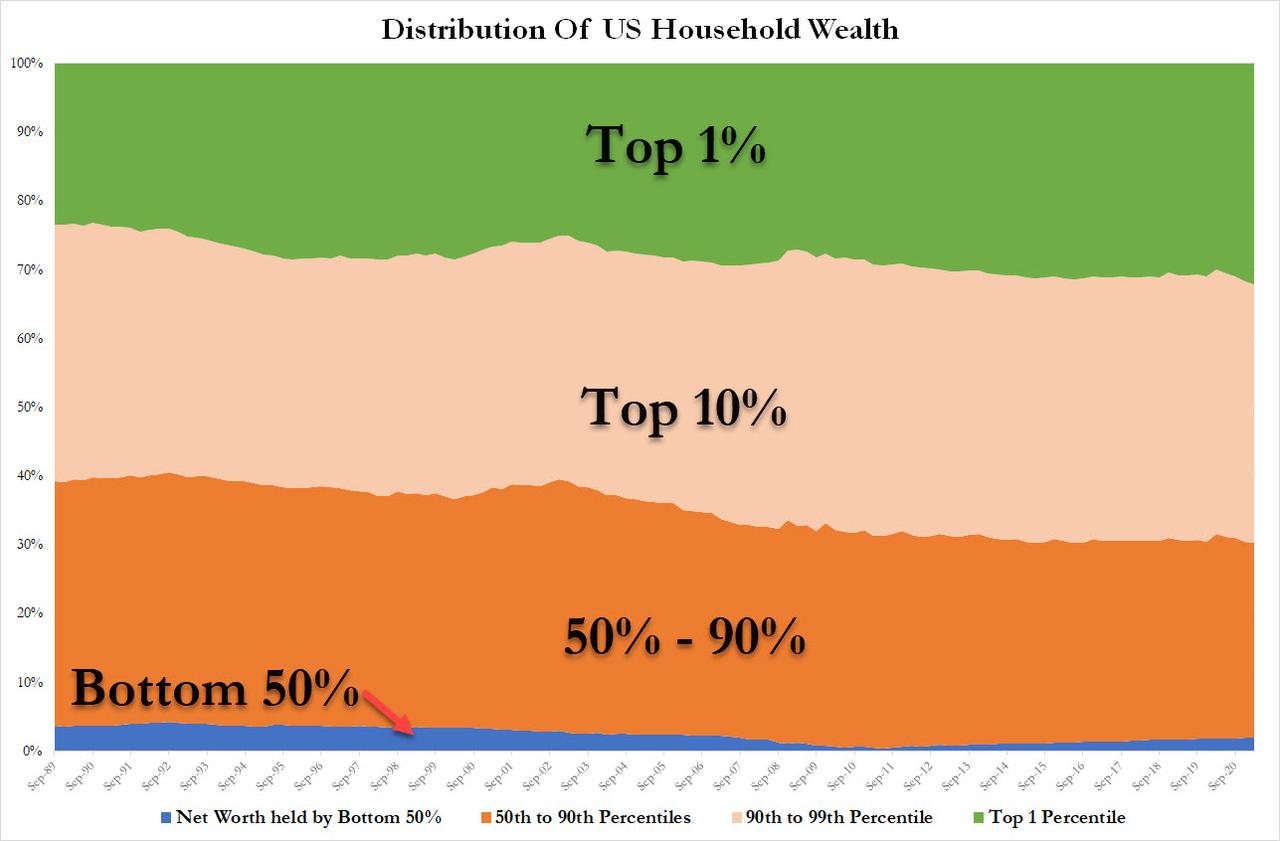
Well, as we previously pointed out, the bottom 50% own just 2% of all net worth, or a paltry $2.8 trillion. What is even more sad is that the wealth of the bottom 50% is virtually unchanged since 2006, while the net worth of the Top 1% has risen by 132% from $17.9 trillion to $41.5 trillion.
But to get a sense of just how precarious the everyday existence of the lower classes is, consider the following stunning fact: Bloomberg reports that according to a poll of 3,616 adults aged 18 and older from NPR, the Robert Wood Johnson Foundation and the Harvard T.H. Chan School of Public Health released on Tuesday, for many Americans the Covid lockdowns - with nowhere to go and nothing to do - was a time to save. But for almost 20% of U.S. households, the pandemic wiped out their entire financial cushion.
The share of respondents who said they lost all their savings jumped to 30% for those making less than $50,000 a year, the poll found. Black and Latino households were also harder hit.
Avenel Joseph, a vice president at the Robert Wood Johnson Foundation, said many people dipped into their savings to cover child or health care expenses. “When crisis hits, or anything goes out of the norm—your child is sick, for example—you are sacrificing wages,” she said. Almost two thirds of households earning less than $50,000 a year said they had trouble affording rent, medical care, and food.
While about two-thirds of people surveyed said they received financial assistance from the government in the past few months, 44% said those programs only “helped a little.”
“We always knew there was going to be an uneven recovery,” Joseph said. “The safety net always had holes, and the pandemic ripped those holes even wider.” Lawmakers in Congress are currently debating how much to spend on shoring up the safety net going forward.
While the staggering social divide is truly sad, and largely a byproduct of the Fed's catastrophic policies in the past decade, it does bring up an important point: while much has been said about the $2 trillion or so in excess savings created during the covid pandemic (assuming most if not all of that has not already been spent to fund the resurgent household spending in the US)...
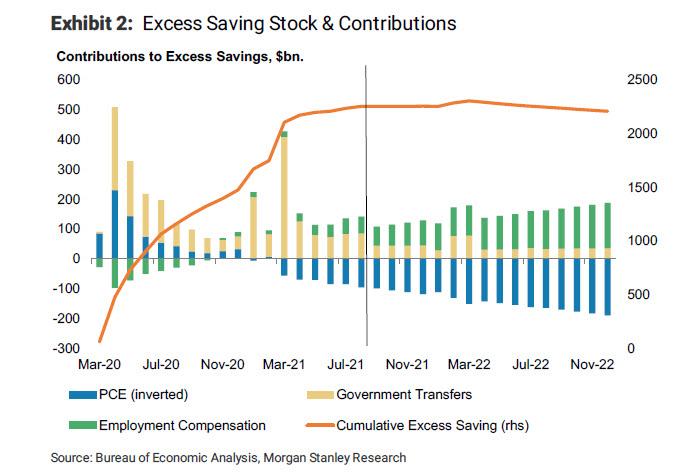
... the reality is that the distribution of savings was also extremely skewed to benefit the wealthiest. And according to Morgan Stanley, the top 20% of US income groups benefited from two-thirds of all savings. The rest, or the "bottom 80%", retained just a third of this (debatable) $2 trillion in excess savings. Here is Morgan Stanley:
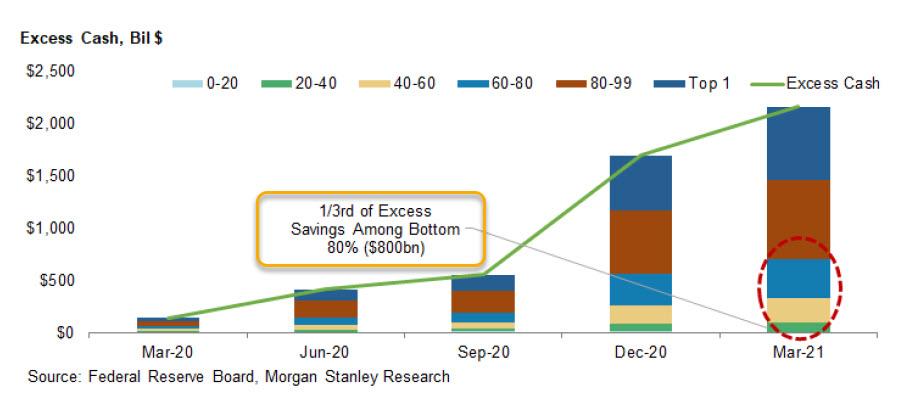
The Fed's Distributional Financial Accounts provide insight on who is holding this tremendous stock in savings:
Looking at cash holdings (checkable deposits and currency) from 1Q20-1Q21 across the income distribution shows that 65% of excess cash (cash accumulated above the 4Q19 level) is held among the top 20%, while 35% is spread across the bottom 80% (top 80% holds ~$1.4tn in excess savings and bottom 80% holds ~$800bn, Exhibit 4).
And, judging by the poll referenced above, the lower 80% have already spent most if not all of their savings!
What are the implications?
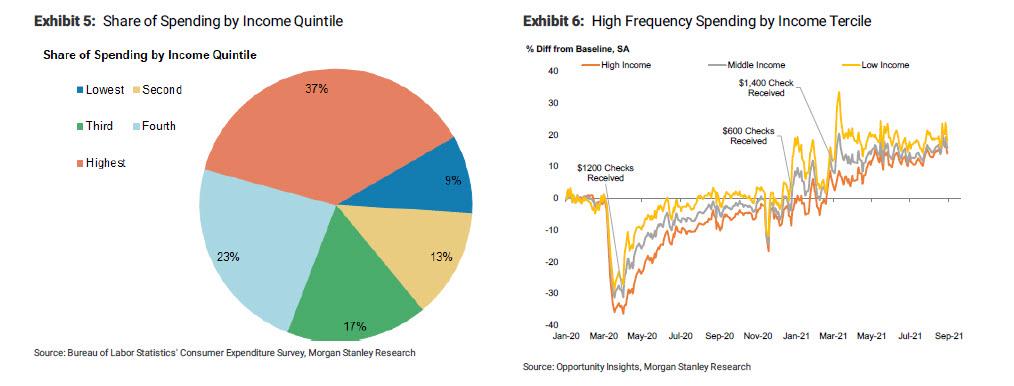
Well, higher income households that hold a tremendous amount of excess savings make up a majority of consumer spending – the top 40% income group represents over 60% of expenditures (Exhibit 5). However, spending by higher income households is not very sensitive to income changes. This is why it is important that the lower-middle income group hold excess savings and have a steady income stream. The transition from government transfer income (unemployment insurance benefits, rebate checks, child tax credits) to labor market income is critical and is expected to support continued spending even as the fiscal impulse fades.
The Opportunity Insights credit and debit card spending tracker by income tercile shows that consumer spending among the lowest tercile has consistently been higher relative to pre-Covid than middle and higher income groups. This holds even through mid- August where we have moved past the immediate bump from rebate checks, when the $600 federal supplemental UI benefits expired last summer, and during the second and third waves of Covid (Exhibit 6).
To summarize: the rich not only got richer, but managed to save up over a trillion. Meanwhile, the "lower 80%" retained just a third of the $2 trillion in excess savings with many if not all cohorts within this segment have already spent all of their savings. As such, any optimistic GDP forecast which assumes that GDP will continue to grow in 2022 as a result of continued spending of "excess savings" by the bulk of the population, such as that done over the past weekend by Goldman (see gray bar in the chart below)...
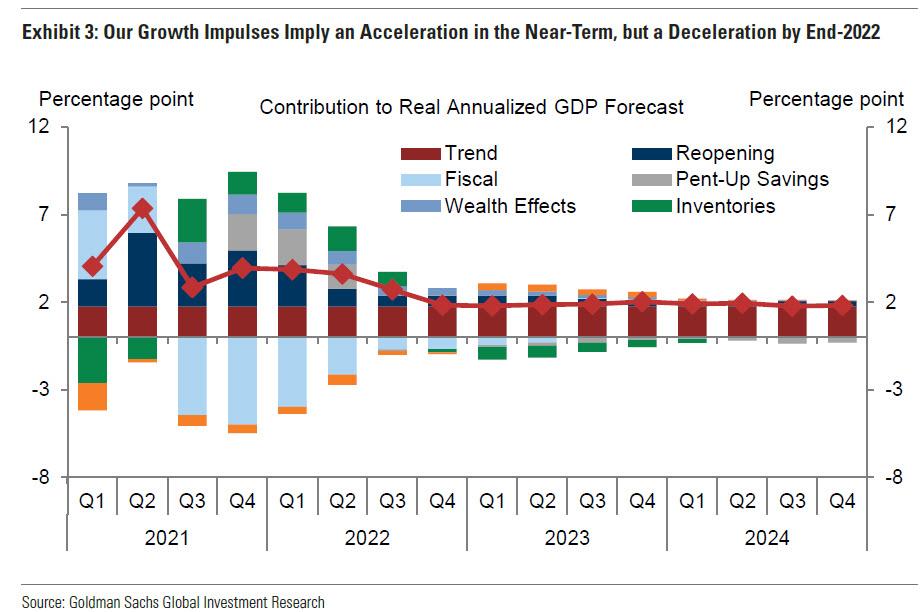
... is terribly incorrect, for one simple reason: that many is gone, all gone. And while the rich still are holding a major portion of their "excess savings", they are far more likely to keep holding to it, or simply invest it in risk assets, which will bring absolutely no benefits to the US economy. It will however, ramp stocks even higher.


